By Cooper Schwieters, Portfolio Manager at Schwieters Capital
Federal Reserve Balance Sheet
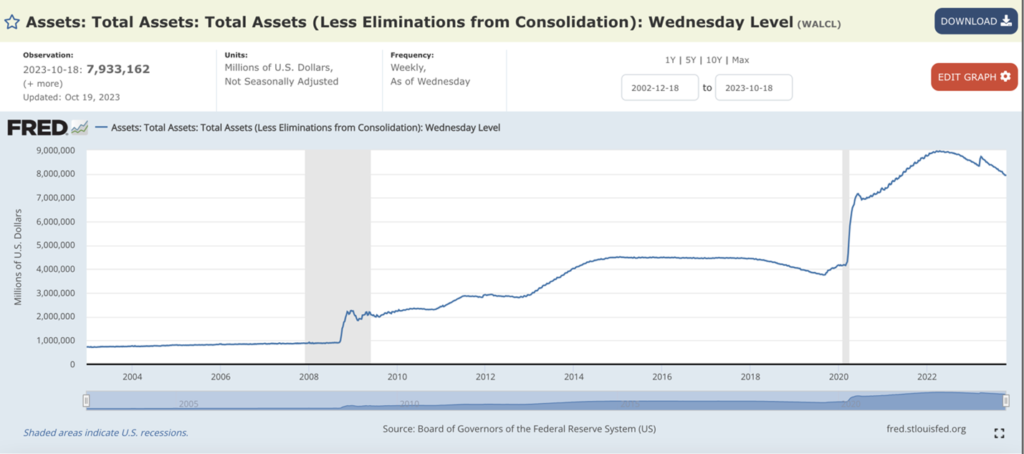
Since March 2022, The Federal Reserve has tightened their balance sheet with Quantitative Tightening by allowing assets to mature and selling other assets on the open market. This form of policy reduces dollars and liquidity in the markets to slow the growth of the economy and reduce inflation. “QT” strengthens the purchasing power of the US dollar.
About 40% of all dollars in circulation were printed during COVID. During periods of money printing, inflation rises. As inflation rises, the Fed begins to pull back market support and starts to reduce money supply by Quantitative Tightening (QT) and tighten monetary policy with raising the Federal Funds Rate.
Effective Federal Funds Rate: Set by the Federal Reserve
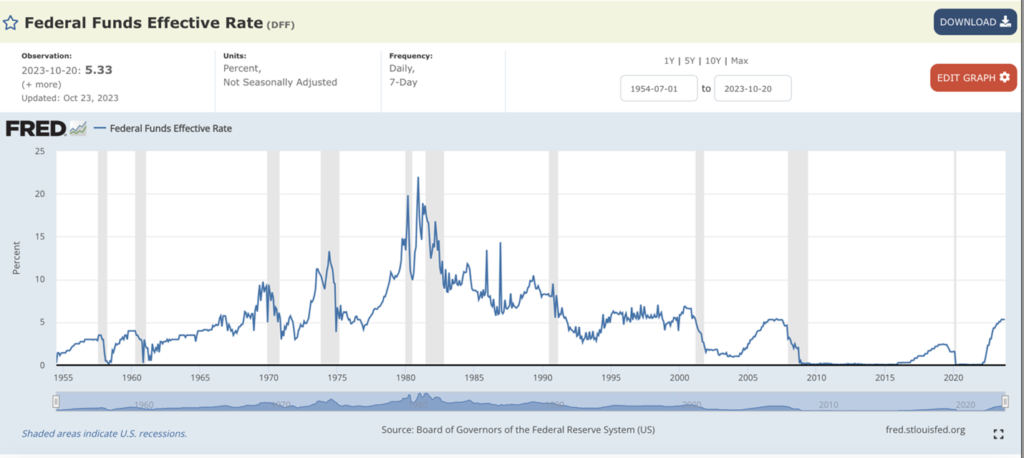
The Federal Reserve began its rate hiking cycle in March of 2022 which became one of the fastest hiking cycles in history as the Fed began its fight against inflation. Money markets and fixed income have once again become a favorable investment as they are now competitive to real estate and stock yields. The “Risk-Free” rate or “The Cost of Capital” is above 5% today.
The Market Risk Profile: Pushing participants down the risk curve back to bonds and cash.

Yield Curve Spread
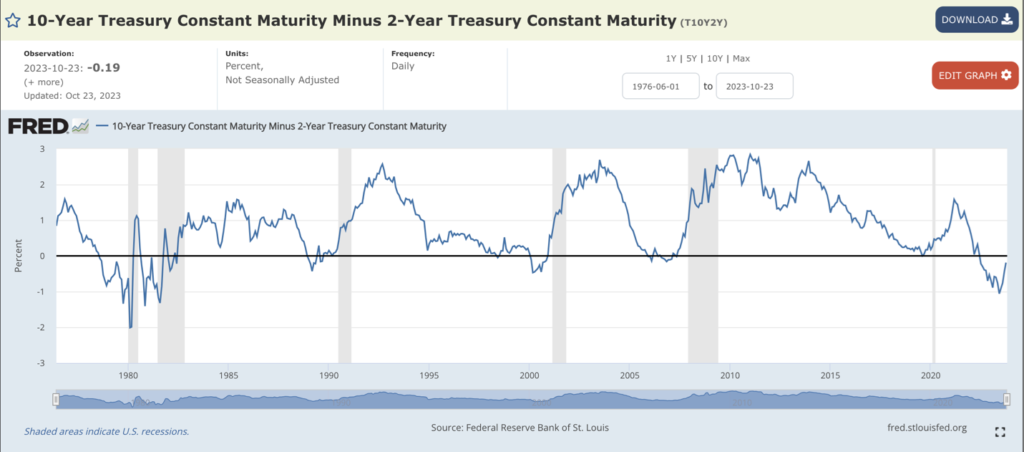
Negative Yield Curve Spread or “Yield Curve Inversion” implies negative future economic activity. Once the yield curve begins to un-invert, risk-on assets like equities typically fall as earnings and economic data begin to deteriorate. When earnings and economic data deteriorate, the labor market is affected with less job openings and a higher unemployment rate.
Theoretically we are waiting for the lag effects to kick in. From this recent change in monetary policy the past year or so, the effects take time to bake into economic data. We are to assume we see a rise in unemployment rate and a decrease in economic data over the next few years unless we see another policy shift from Powell and the Federal Reserve. The Bank Term Funding Program was a slight version of market support from the Fed in March. The liquidity supported regional banks from bankruptcy and financial crisis.
Bank Term Funding Program: BTFP
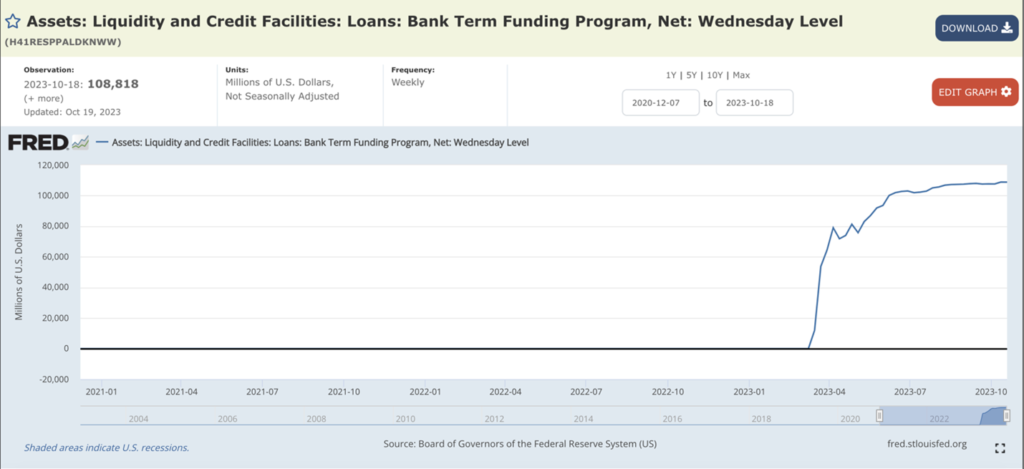
During March of 2023, the market showed cracks in the banking system caused by the rapid rise in interest rates. Within a week of regional bank failures, the Fed stepped in and created BTFP which allows certain banks to access liquidity by posting their underwater bonds for 100% par value. The equity market instantly bottomed with liquidity support provided by the Fed. Even though everything seems to be fine, this has exacerbated the underlying issue of unrealized losses on bank balance sheets. The BTFP has been flat for a few months around $110 Billion.
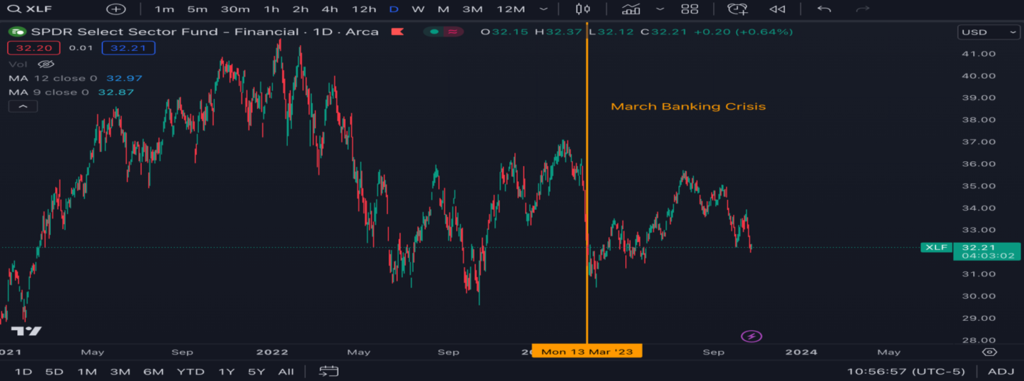
US Banks own “Held to Maturity” assets like US bonds and the rapid decline in bond values created a massive hole in bank balance sheets. The unrealized losses in the banking system is still north of $600 billion dollars today. US regional banks and other major banks are back to March Banking Crisis levels. (See Chart below)
XLF: US Bank Financial ETF
2 Year Treasury Yield (Candlesticks) Versus Federal Funds Rate (Orange)

Technically the Fed has reached its restrictive rate policy goal by analyzing shorter term yields and the federal funds rate. This implies that we have reached the end of the rate hiking cycle even though there is commentary by Fed Speakers and Powell that the terminal rate might be higher. Keep in mind that the recent surge in 20–30-year US bond yields in September and October is equivalent to 2-3 rate hikes.
SPX: S&P 500 Index

BTFP seems to be tapped out at around $110B in late August. At that point in time, the market started to sell and begin a downtrend that has created a bearish market structure of lower lows and lower highs. SPX is sitting on the 200 simple moving average now and is an iconic technical level.
For the first time in over 20 years, short term treasuries yield more than SPX earnings.

Conclusion
With the rapid rise in interest rates (cost of capital), the investment risk curve has been significantly changed. 10+ years of low interest rates caused investors and market participants to chase yield in more risky assets. The era of low interest rates that pushed investors and market participants up the risk curve to real estate, equities, and risky debt is over for now. Participants now are inclined to seek cash, or cash equivalents (treasuries) that produce a “risk free” rate of ~5% instead of buying/developing real estate or investing in equity yields that are at similar levels but have higher risk profiles. We are yet to see the repricing of asset classes like real estate and certain sectors of the equity market. Also, the lag effects of these monetary policies have yet to show up in US economic data.
Disclaimer: This newsletter is not trading or investment advice, but for general educational purposes only. This newsletter represents my personal opinions which I am sharing publicly as a newsletter. Futures, stocks, bonds trading of any kind involves risk. I guarantee no profit, you assume the entire cost and risk of any trading you choose to undertake. You are solely responsible for making your own investment decisions. Owners of this newsletter, its representatives, its principals, its moderators, and its members, are NOT registered as securities broker-dealers or investment advisors either with the U.S. Securities and Exchange Commission or with any other securities/regulatory authority. Consult with a registered investment advisor, broker-dealer, and/or financial advisor. Reading and using this newsletter or any of my publications, you are agreeing to these terms.


